US$80B AI Selloff After 3.7% US Inflation Print
Hot US inflation triggered a US$80 billion AI selloff and pushed 5-year yields to their highest since 2007.
 01/11Photo: CC0 via Openverse
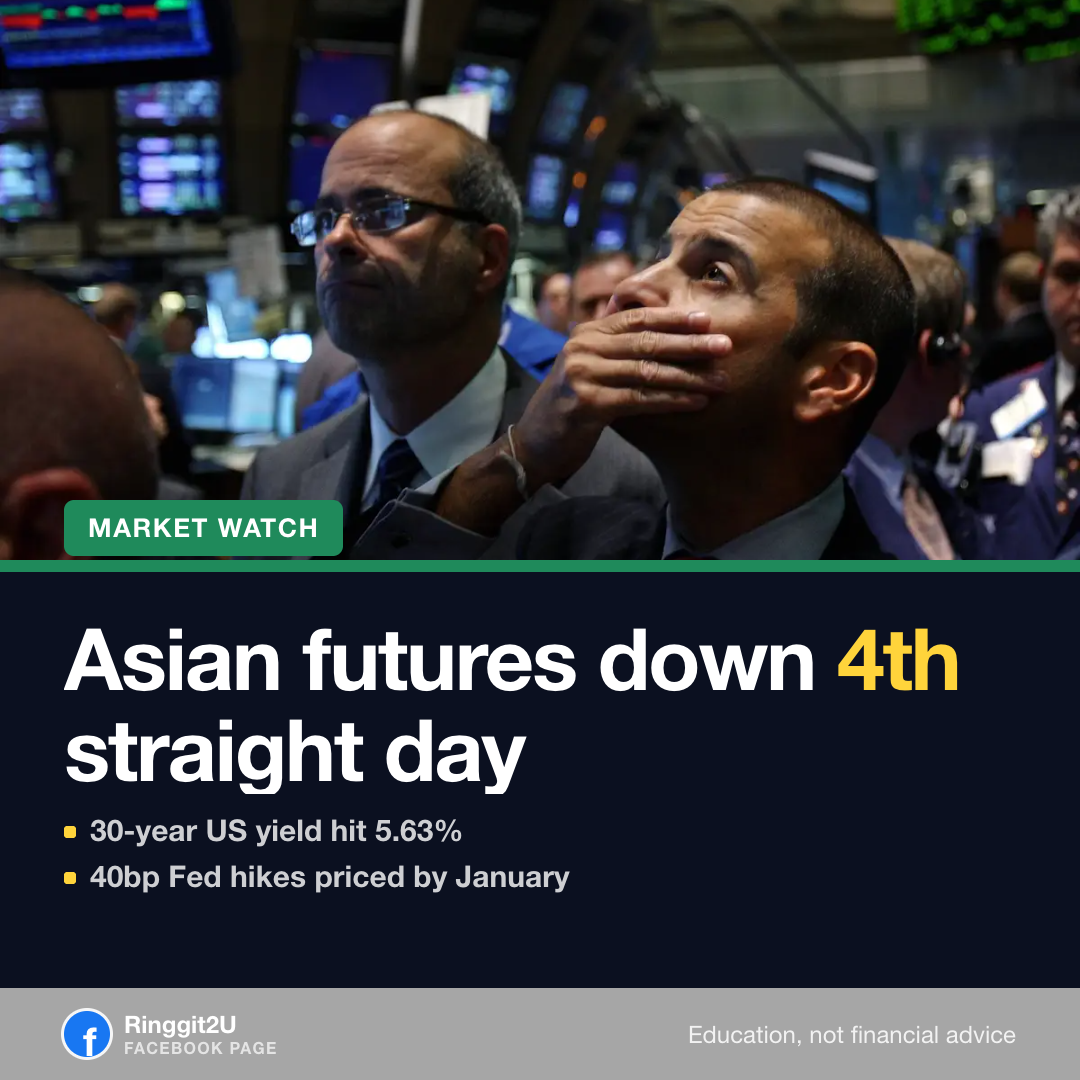
AI stocks selloff after hot US inflation print September CPI rose 3.7% year-on-year, the fastest in five months; Asian equity futures fell for a fourth straight day. - 02/11
US inflation hits fastest pace in five months ✓US CPI year-on-year, September 3.7% Up 0.6% from August, driven by rising fuel costs after Middle East hostilities pushed Brent above US$106. - 03/11VS
S&P 500 index Near all-time highs Median S&P 500 stock ~17% below its peak The index is up, the median stock is not Nvidia, Apple and Microsoft make up over 21% of the S&P 500; the other 497 stocks tell a different story. - 04/11
Four AI names lost US$80B in one session Monthly statement CoreWeave -16% Nebius -11% Oracle -9% Dell Technologies -11% Combined market value erased ~US$80B CoreWeave, Nebius, Oracle and Dell all fell on the day after the inflation print. - 05/11
Bond yields jump to multi-year highs 5-yr 5.15%, first time since 2007 10-yr 5.19% at close 30-yr 5.63% intraday Dollar Highest in over a year Fed pricing ~40 bps of hikes by end-Jan
The 5-year yield topped 5.15% for the first time since 2007; markets now price ~40 bps of Fed hikes by end-January. - 06/11
Why AI infrastructure stocks took the hit Higher borrowing costs squeeze companies that fund data-centre buildouts with debt. CoreWeave's June bond, issued at 9.625%, recently traded at 15%. - 07/11
US tech ETF and index-fund holders Asian equity traders (4th day down) Fuel-cost watchers (Brent > US$106) Corporate bond investors (CCC spreads > 1,000 bps)
Who feels this in their portfolio Asian futures for Japan, Korea and Australia fell for a fourth straight day; Brent sits above US$106.  08/11Photo: CC0 via Openverse
The buildout behind the selloff Tech infrastructure capital raising reached US$346 billion year-to-date, double the US$172 billion the prior year. - 09/11
People say “
The S&P 500 is near its all-time high, so the market is broadly healthy. ”The rule says The median S&P 500 stock is about 17% below its peak; 60% of Nasdaq 100 names are in a bear market. All-time-high index does not mean a healthy market Nearly 60% of Nasdaq 100 stocks are down at least 20% from their peaks; the index is propped up by a handful of mega-caps. - 11/11
Three stocks, 21% of the entire S&P 500 The median S&P 500 stock is already about 17% below its all-time high; the index has nowhere to hide if leadership cracks.
Questions people ask
What caused the US$80 billion AI stock selloff?
September US CPI rose 3.7% year-on-year, the fastest in five months. Higher inflation pushed bond yields to multi-year highs, hitting AI infrastructure companies that fund buildouts with expensive debt.
Why did Asian markets fall for a fourth straight day?
Equity-index futures for Japan, South Korea and Australia all declined after the hot US inflation print, tracking the tech-led Wall Street selloff and higher Fed rate-hike expectations.
Is the S&P 500 still at its all-time high?
The index sits near its all-time high, but the median S&P 500 stock is about 17% below its peak and nearly 60% of Nasdaq 100 names are in a bear market. Three stocks carry over 21% of the index.
Keep reading
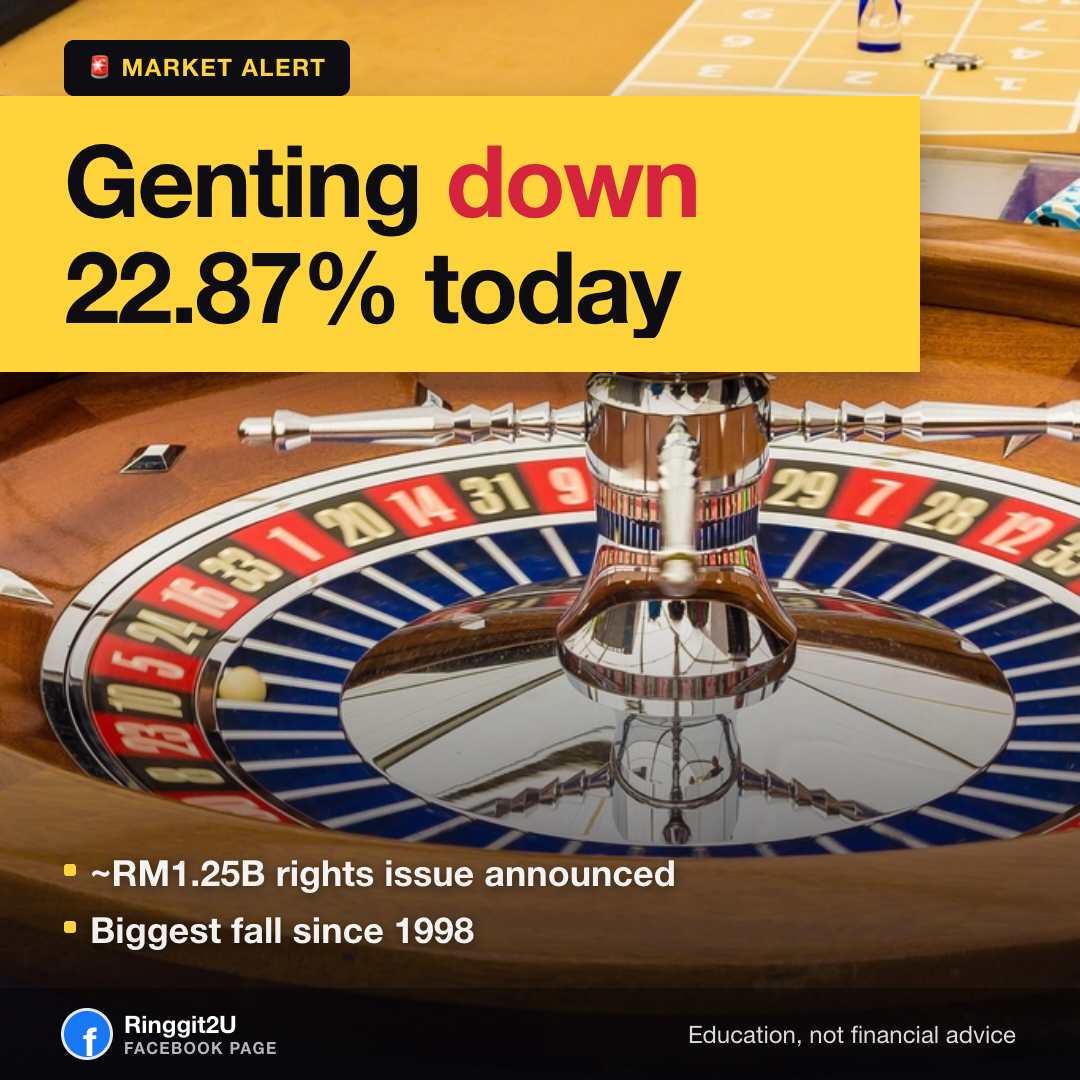
Genting 22.87% Crash: What the RM1.25B Rights Issue Means for You
Genting shares fell as much as 22.87% on the RM1.25B rights issue announcement.
STR 2027 & SARA 2027: Step-by-Step Online Application Guide
LHDN opens STR 2027 and SARA 2027 online applications on 15 October 2026. Payouts range from RM600 to RM4,600. Step-by-step guide to apply or update your details.
Gold Falls Below USD 4,100 After Hot US CPI Data, Fed Hike Fears
Gold broke below USD 4,100 on 14 Oct 2026 after hot US CPI data revived October Fed rate-hike bets. Nasdaq fell 2%. What moved, why it matters, and what it does not change.