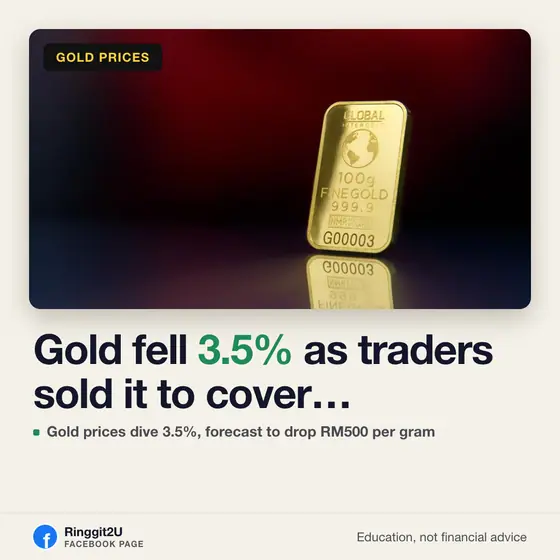
Gold crashes 9% in a week to 15-month low; spread widens
Spot gold fell nearly 9% in five sessions to $3,537.87, its worst week since March, driven by hawkish Fed signals and AI stock selloffs.
What happened1/6 Gold posts worst weekly drop since March
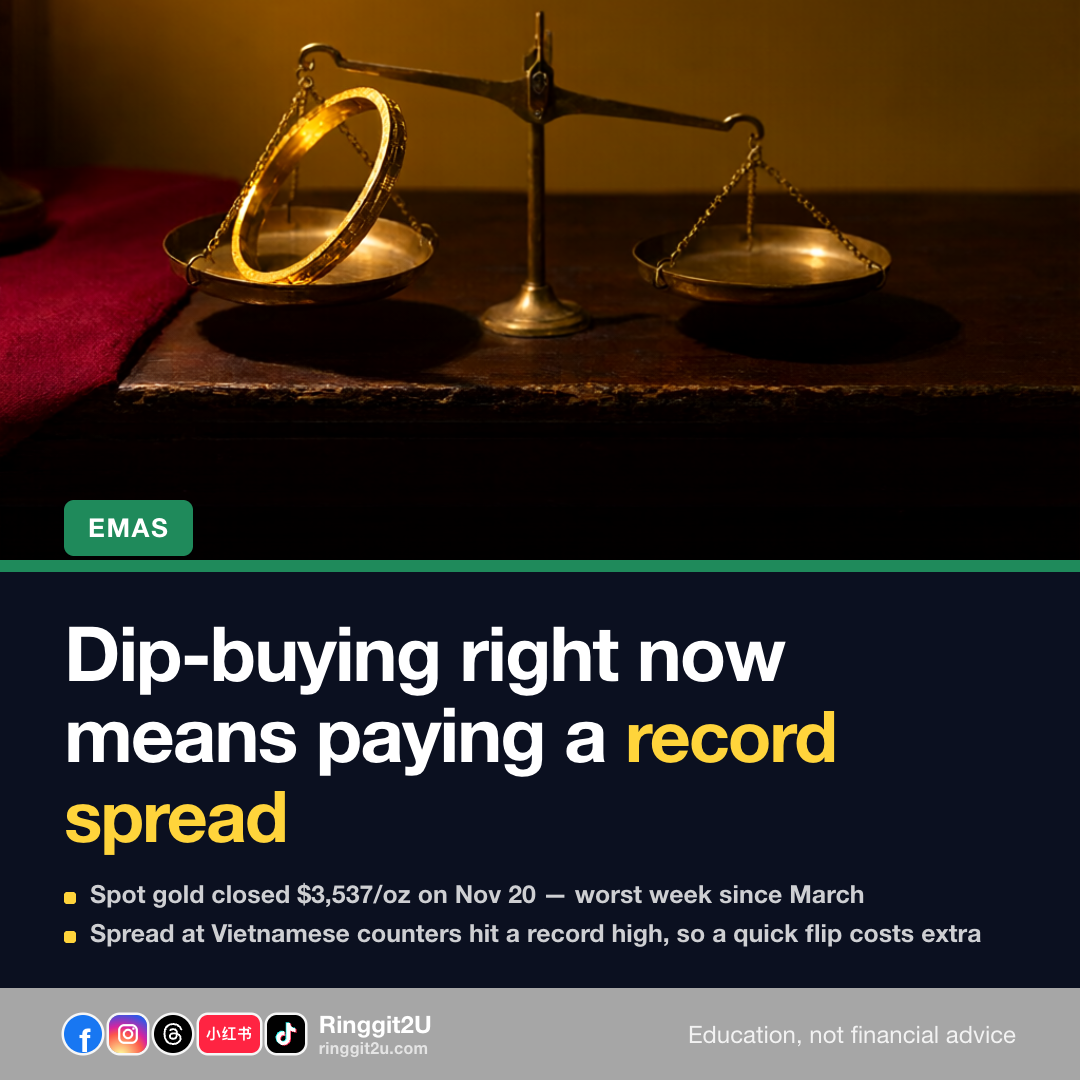
Spot gold closed at $3,537.87 an ounce on Nov. 20, marking a decline of nearly 9% over five consecutive trading sessions. This is the metal's worst weekly performance since March.
Prices have retreated about 37% from their January record high of $5,598.75. In Vietnam, local gold bars hit a 15-month low, while Chinese jewelry prices fell for 10 straight days.
The real numbers2/6 The scale of the drop
-9%Weekly price decline$3,537.87Spot gold close (Nov 20)37%Drop from Jan record highGold broke through five key price thresholds ($4,000 to $3,600) in just eight trading sessions. The drop represents a loss of almost $350 an ounce in one week.
Real U.S. Treasury yields climbed from roughly 1.7% to near 2.9%, directly reducing the appeal of holding non-yielding assets like gold.

Photo: Photo: Smiths (maker) / BY-NC-SA 4.0 Why it matters3/6 Why the price fell
The primary driver is the Federal Reserve's shift toward higher interest rates. Market expectations flipped from rate cuts to potential hikes, pushing the dollar stronger and making interest-bearing assets more attractive than gold.
A separate factor was the AI-related stock selloff. Analysts noted that some investors were forced to liquidate gold positions to cover losses in equity markets, creating additional selling pressure.
How it affects your wallet4/6 The spread trap: a warning from Vietnam's gold counters
While global prices fell, the buy-sell spread (the difference between what you pay to buy and what you get when selling) hit record highs at Vietnamese gold counters. This means the effective cost to enter a position is higher than the spot price suggests.
e.g. If the spread widens significantly, a 5% drop in spot price could still result in a net loss for a short-term buyer who sells immediately, because the selling price is discounted further below the buying price.
- 01/02
-9% Weekly price decline The scale of the drop Weekly price decline
What to watch5/6 What to watch next
Investors are monitoring Federal Reserve communications for signals on future rate hikes. Philadelphia Fed President Paulson recently stated openness to consecutive increases.
Institutional views remain divided: Goldman Sachs cut its price target twice in a month, while Morgan Stanley and Standard Chartered remain bullish. Global central bank buying and gold ETF inflows still provide long-term support.
Worth knowing6/6 Malaysian context
Bank Negara Malaysia kept the Overnight Policy Rate (OPR) at 2.75% in September 2026. While local policy is stable, global gold prices are driven by US monetary policy and dollar strength, not local OPR changes.
- 02/02
The scale of the drop ✓Spot gold close (Nov 20) $3,537.87 Spot gold close (Nov 20)
Questions people ask
Why did gold crash when the stock market is also falling?
Some investors sold gold to cover losses in AI-related stocks (forced liquidation). Expectations of higher US interest rates make bonds and savings accounts more attractive than gold, which pays no interest.
Does this affect my EPF savings?
No. EPF is a statutory retirement fund with a diversified portfolio. Its dividends are declared annually by the board and are not directly tied to daily gold price movements.
Is it a good time to buy gold?
This is an educational overview, not investment advice. Gold is volatile. Consider your risk tolerance, investment horizon, and the wide buy-sell spreads before making any decision.
Source: The StarBigGo FinanceE.vnexpress